
Every Outage We Had Was Correct Code
Our worst production incidents weren’t bugs. They were working code running in the wrong place. Here’s what four of them taught us about architecture.
Three analysts clicked Export at about the same time.
A few seconds later, Samuhika Portal looked like it had gone down. Health checks were timing out and normal requests were queuing.
But nothing had crashed.
The export code was doing exactly what we built it to do: generating editable PowerPoint board decks. The problem was where it ran. CPU-heavy work sat on the web request path and starved everything behind it.
It wasn't the only time.
A database join that returned the right answer took a dashboard from milliseconds to seconds. An ORM mapping that suited transactional screens got painfully expensive on an analytical one.
The code was correct every time. Its placement wasn't.
The most serious incidents we saw on Samuhika weren't caused by obviously incorrect code, and that changed how we run architecture reviews.
"Does this work?" still comes first. Then we ask:
- Where does this logic run?
- How often does it run?
- What happens to the rest of the system when it gets slow or fails?
Here are four places the pattern showed up, and what we changed.
Some context
Samuhika Portal is the governance platform we built for GAIL (India) Limited. About 30 joint ventures and subsidiaries report through it, and every quarter their numbers end up in front of a board.
So each number has to be traceable, reviewed, and locked once approved.
Before the portal, this ran on Excel, scanned PDFs, and a three-week reconciliation scramble.
The workload is lopsided. Writes are rare, but each one is reviewed by several people and trusted by a board. Reads happen all day.
So we set one rule early:
Spend complexity where volume is lowest.
Be strict on the write path, and keep the read path so simple it can't fail in interesting ways. Most of what follows is that rule, learned the hard way.
1. Workflow: the rule lived in too many places
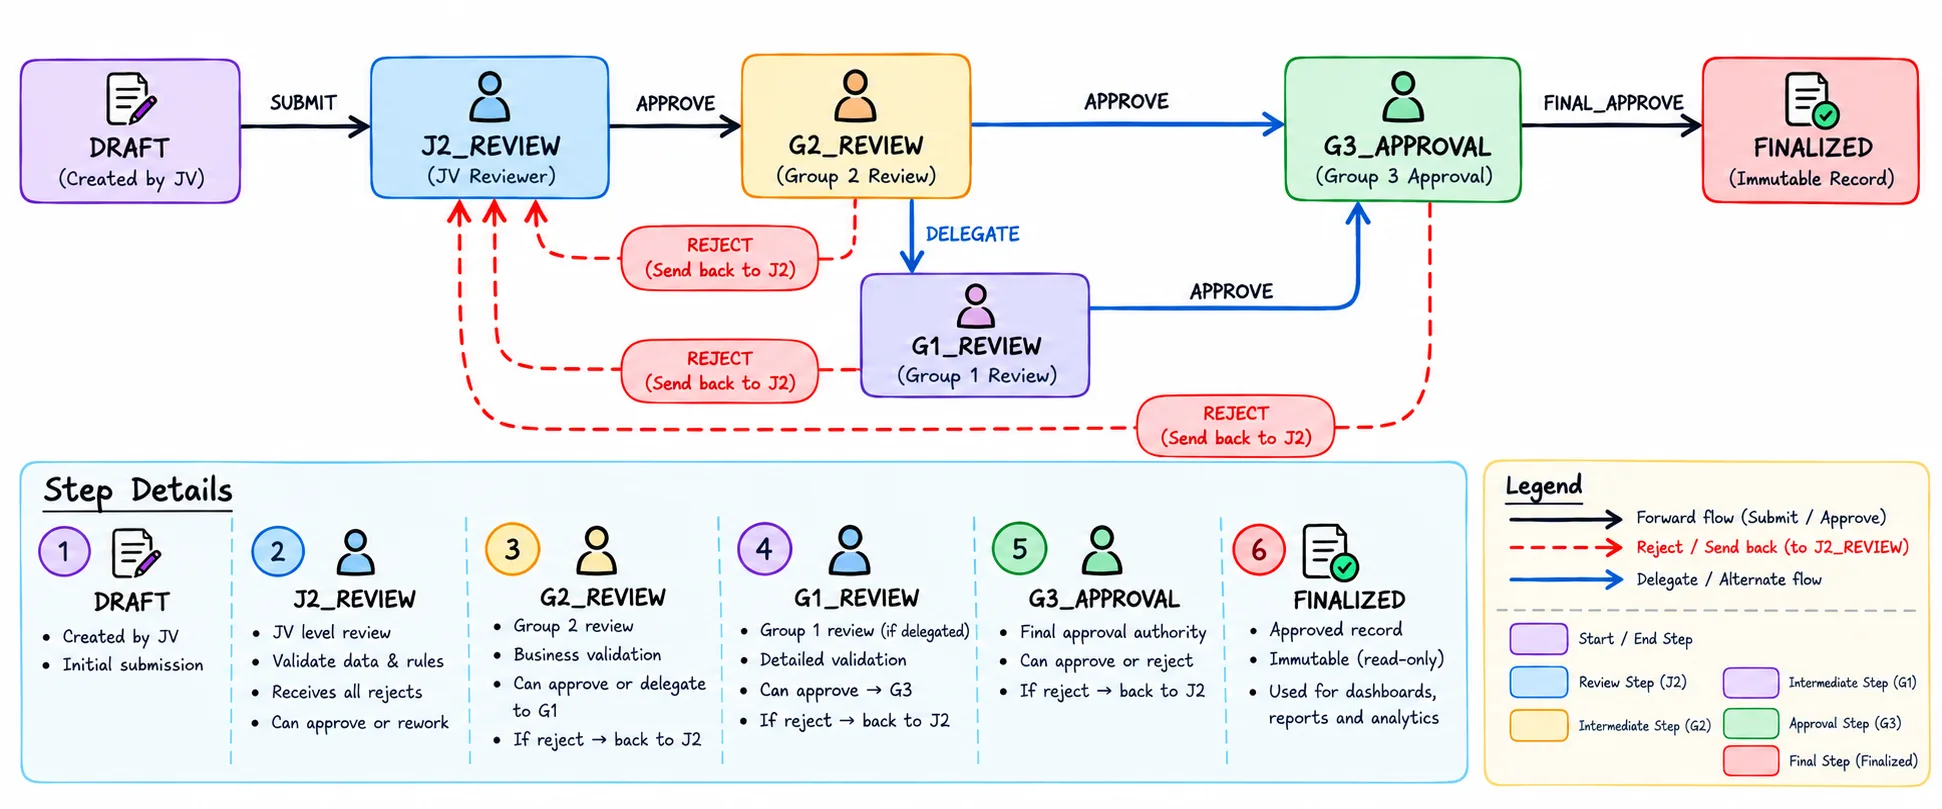
Every submission passes through up to five review roles, from the JV's data entry user (J1) up to a senior GAIL approver (G3).
Once G3 approves, it is FINALIZED and locked for good. Along the way, a reviewer can send it back for fixes, and G2 can delegate it to another reviewer.
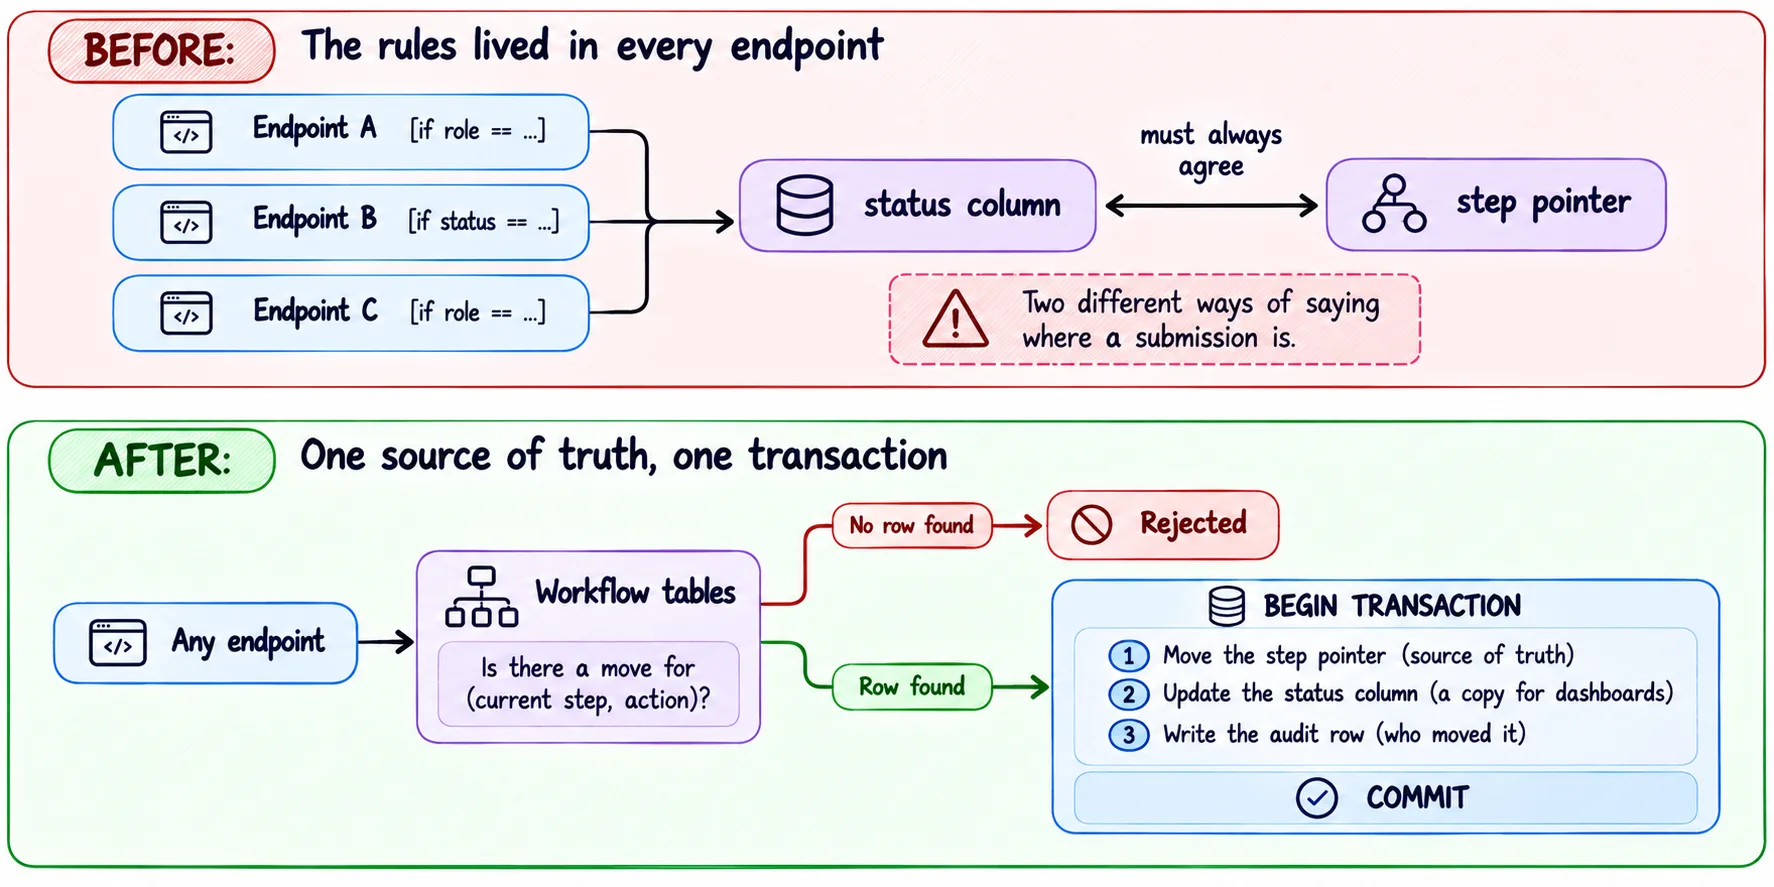
The problem. Our first design was the usual one: each API endpoint carried its own checks, like "is this user allowed to approve?" and "is the submission in the right state?"
The submission's position was also tracked in two places: a status column and a separate step pointer.
That caused two kinds of trouble:
- Every new endpoint needed the same checks copied in, and if one was forgotten, someone could skip a step.
- If the two position fields disagreed, you got confusing bugs.
The fix. We moved the workflow into the database as data. It stores the steps, the roles allowed to act at each step, and the allowed moves, each written as (current step, action) → next step.
A submission's current step is the single source of truth. The status column is now just a copy used for dashboard filters, updated in the same transaction as the move.
The audit row is written in that same transaction too, so a submission never advances without a record of who moved it.
If no move is defined for a step and action, it simply can't happen. And a new endpoint has no validation to forget.
Because the workflow is just tables, we can also check its structure with queries instead of relying only on tests and code review. Does every step lead to FINALIZED? Do send-backs only point backwards?
Why not a workflow engine? We looked at Elsa and Temporal but passed. They're built for long-running, distributed workflows, and ours is paced by humans and fits inside one database transaction.
The cost. There's no visual designer. And because the workflow is read live, an edit affects submissions already in progress.
So we treat workflow edits like schema migrations.
2. Dashboards: a correct join on the hottest path
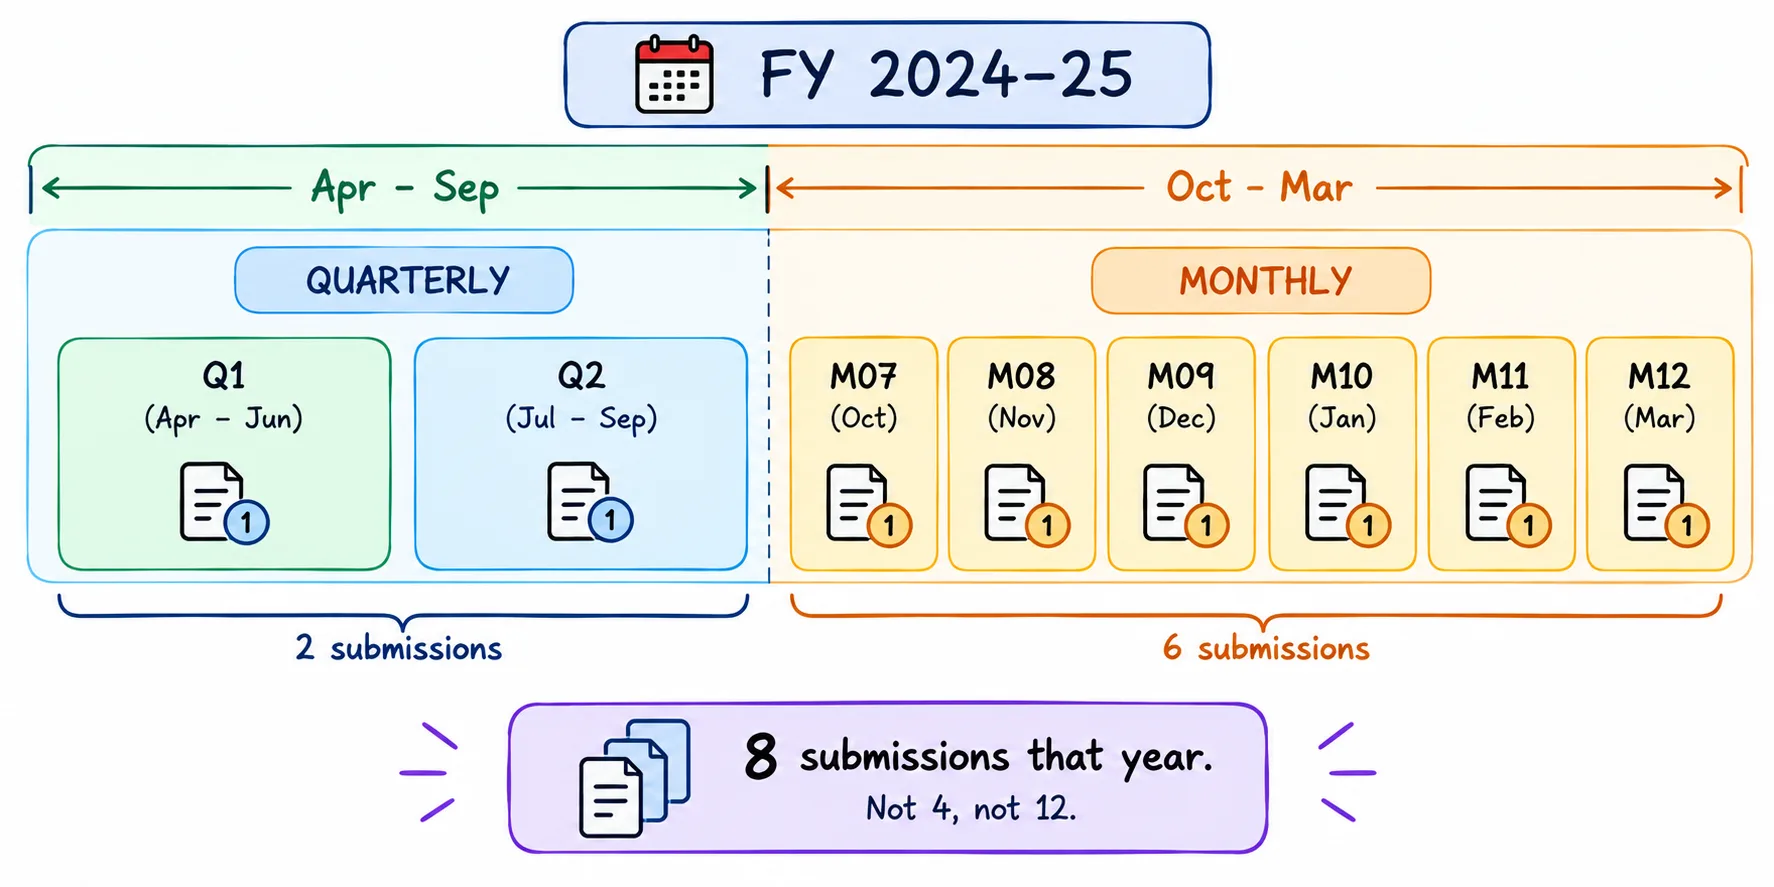
One subsidiary reported quarterly from April. In October, a regulator moved it to monthly reporting.
So within a single fiscal year, it had two different schedules.
The problem. Our first design modelled this faithfully: dashboards joined the fact data to the frequency configuration and used its effective dates to decide which periods counted. The answers were right.
On production data, though, Oracle's optimizer made poor selectivity estimates for that range join and picked a plan that stopped using our indexes.
The result:
- A 45 ms query climbed to nearly 2 seconds
- Cross-JV views began timing out
The query wasn't wrong. We were evaluating a business rule on every dashboard load, thousands of times a day, when it only mattered once: when the data was written.
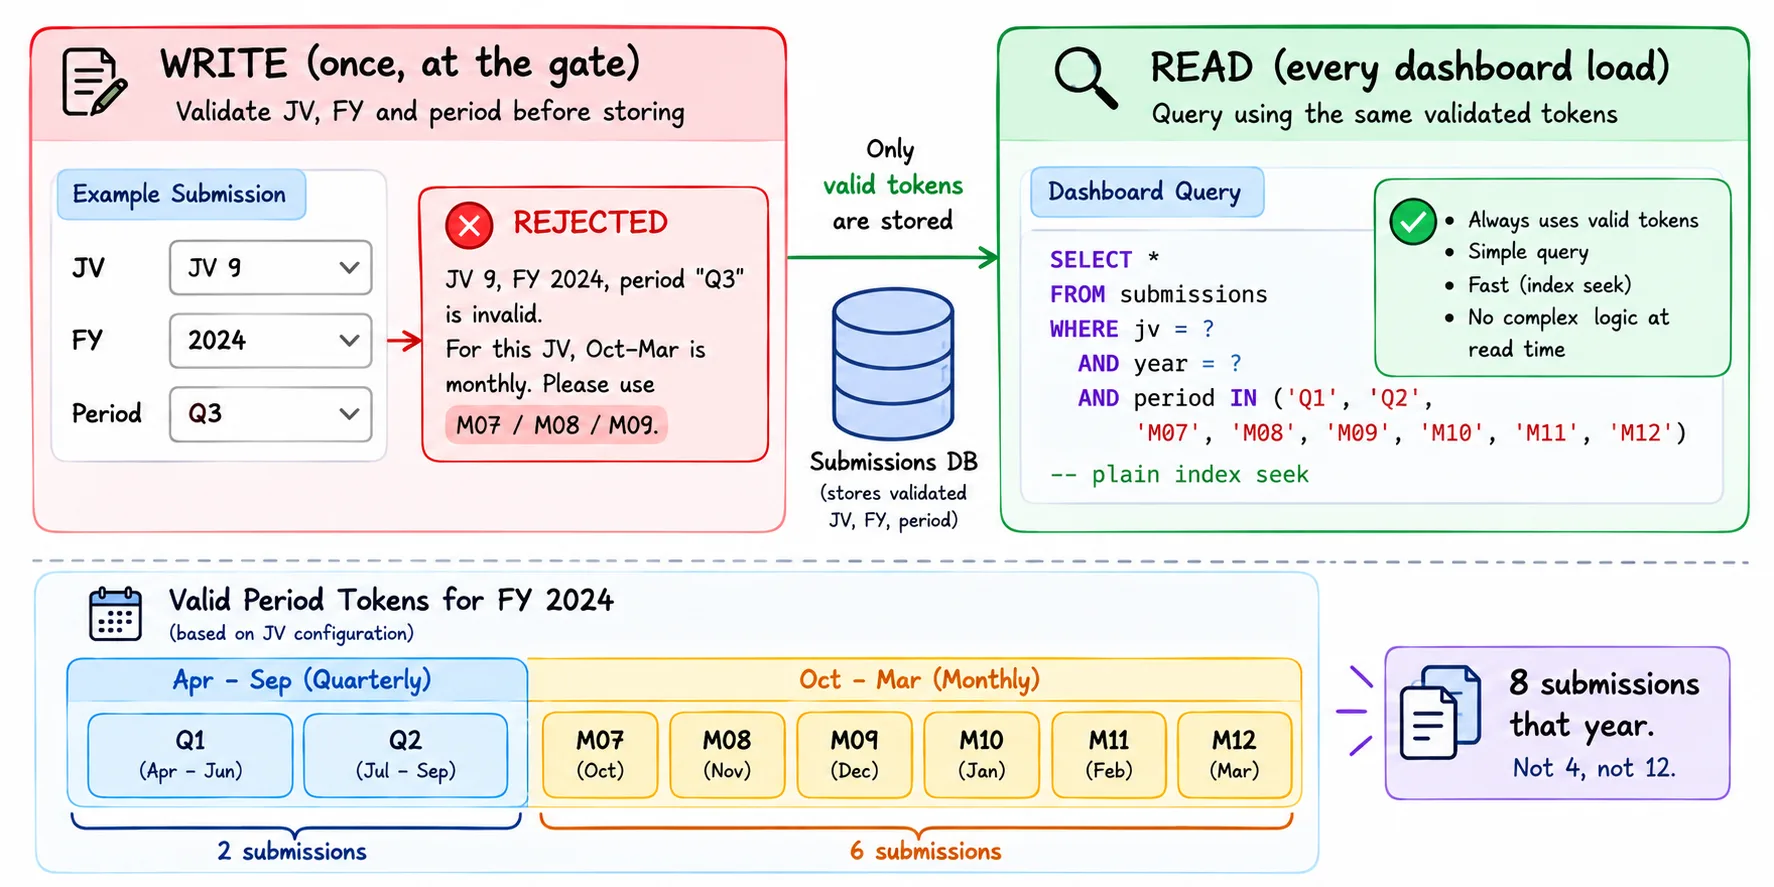
The fix. We moved the rule to the write path. Each submission is now validated against the frequency config at ingestion and stored with a fixed period token like Q1, M07 or ANNUAL.
Reads became plain equality lookups on a composite key, and the query dropped to 18 ms.
Bad data is rejected at the door, so nobody downstream has to interpret it.
The cost. A token stores the result of a rule, so a retroactive cadence change means a backfill.
Those are rare and deliberate, and they should feel heavy.
3. The ORM: right tool, wrong question
Our slowest page, the cross-JV benchmark view, took 1,240 ms and 48 MB per request.
It was tempting to blame EF Core, but that wasn't the problem.
The problem. The page asks a flat question: one row per JV, with financial columns and a list of metrics.
We were answering it by materializing about 1,500 tracked entities, with child collections multiplying the rows.
ORMs are built for aggregates with identity and change tracking, and this page needed neither.
The fix. Analytical reads now use plain SQL returning flat rows, stitched together by key. The ORM keeps the transactional side.
| Before | After | |
|---|---|---|
| Latency | 1,240 ms | 18 ms (~69x) |
| Memory per request | 48.2 MB | 1.8 MB |
| DB connection hold time | 1,180 ms | 14 ms |
People quote the first row. The last one mattered more.
On a shared Oracle instance with a bounded connection pool, hold time decides how many people can open a dashboard at once on close day.
Users feel latency. You plan capacity around hold time.
4. Export: back to the three analysts
Board decks have to be real, editable PowerPoint files.
Building one with the OpenXML SDK means creating thousands of XML nodes and doing layout math. That is pure CPU work, and we were doing it on the same threads that serve web requests.
When three exports ran at once, they used up so much CPU and ThreadPool capacity that normal requests and health checks had to wait in line behind them.
One button could slow down the whole application.
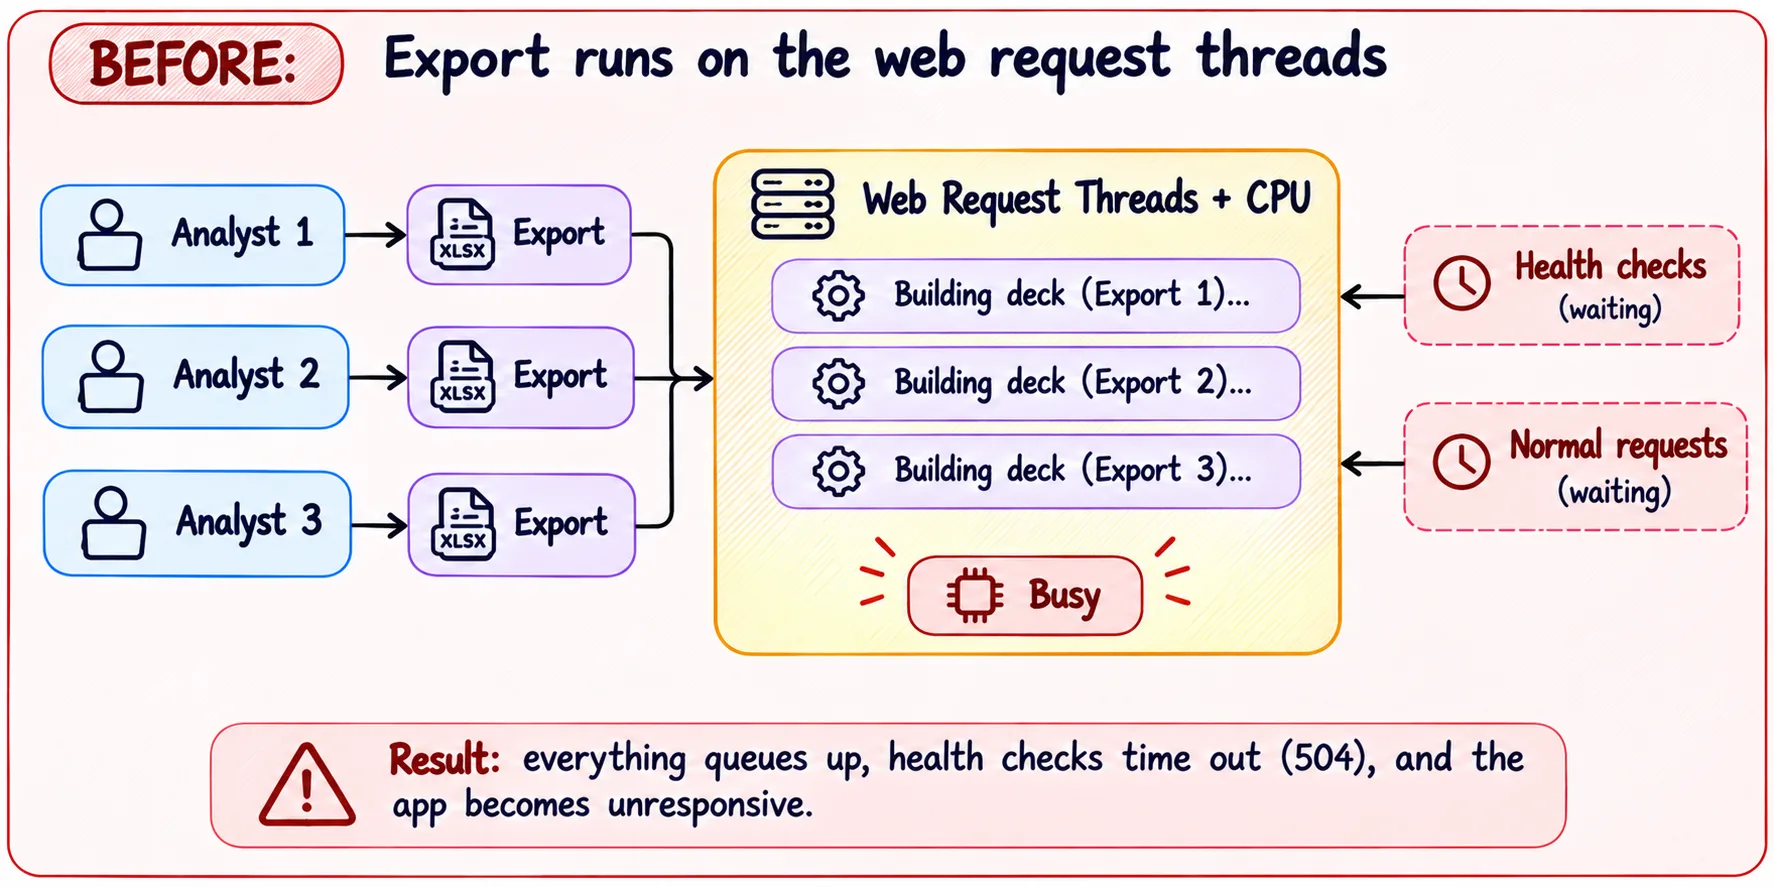
Async/await would not have saved us. There was nothing to await. CPU-bound work doesn't get cheaper by being asynchronous. It has to leave the request path.
The fix. Now the API hands back a ticket immediately, and a background worker builds the deck from templates that are parsed once at startup.
Generation time fell from 8.4 seconds to 1.1, and the web side stays steady while decks are being built.
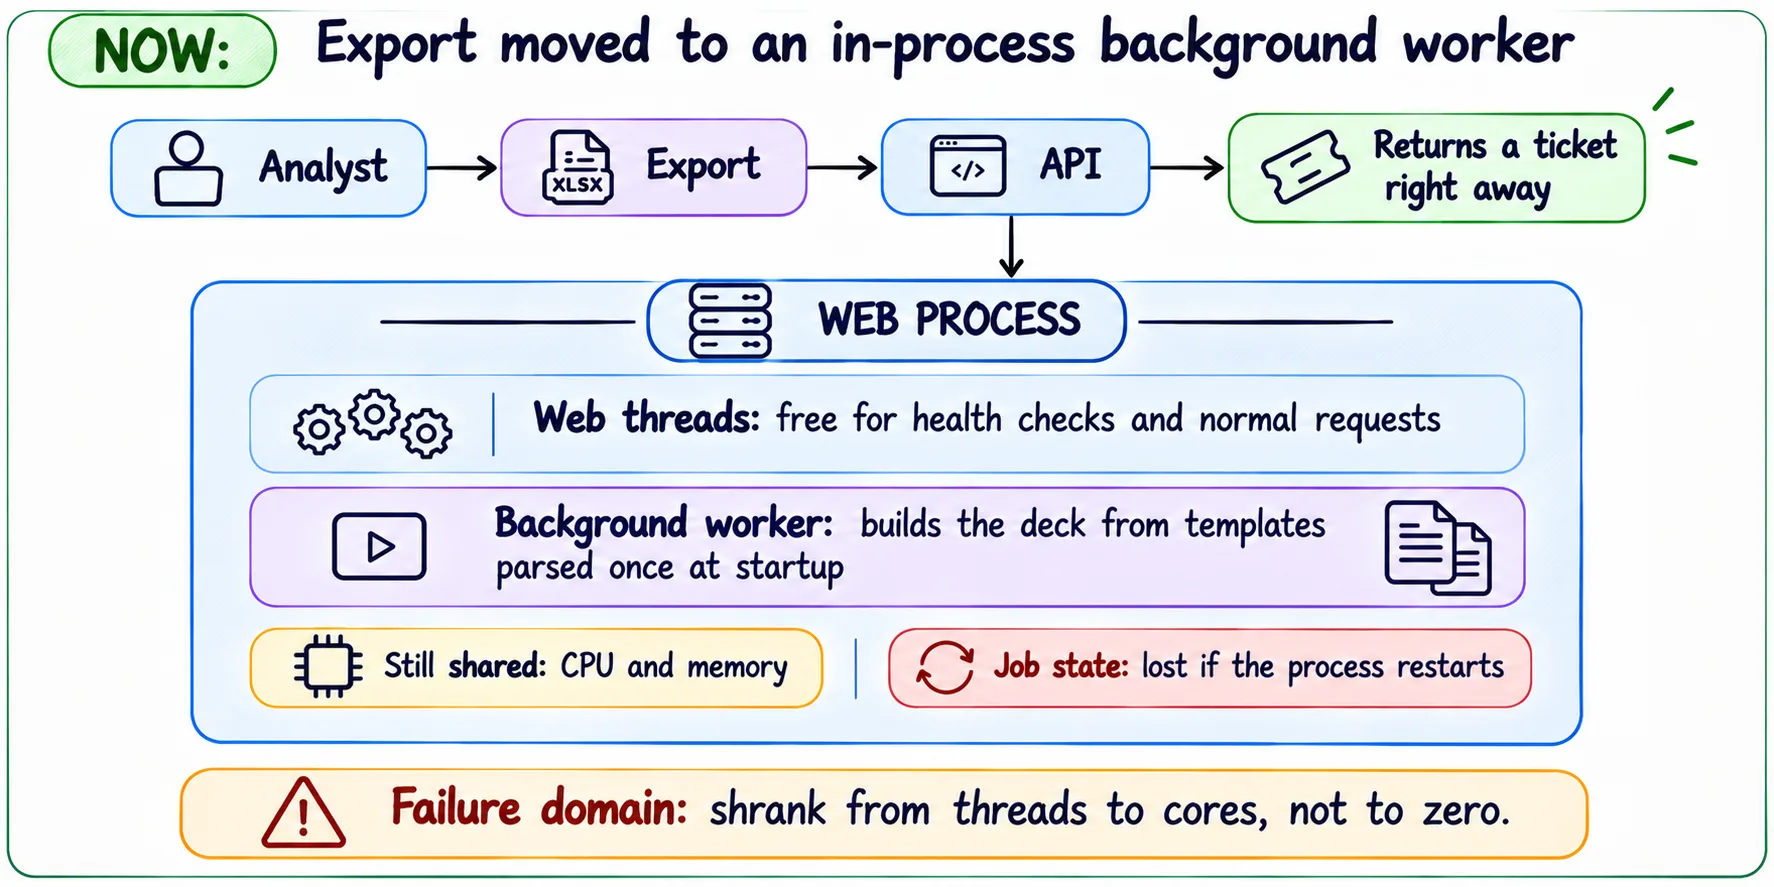
The cost. This is a middle step, not the final design.
- The worker still runs inside the web process, so it shares CPU and memory with the web app
- Job state is lost if the process restarts We shrank the blast radius from threads to cores, not to zero.
Next we plan to move workers out of the process, behind a message broker. But even the cheap version ended this class of incident right away.
The ledger
Every decision in this post had a cost. Here is each one side by side, so you can see what we gave up and what we got back.
| What we did | What it cost us | What we got |
|---|---|---|
| Stored the workflow in database tables instead of using a workflow engine | No visual designer, and workflow edits must be handled like schema migrations | Moves, status and audit rows commit together, we can query the workflow, and there is no new infrastructure to run |
| Validated the reporting schedule when data is written, and stored a period token (Q1, M07, ANNUAL) | Changing a schedule retroactively means backfilling the tokens | Dashboard reads became simple index lookups |
| Used hand-written SQL for analytical reads | We map results by hand, and a typo only shows up at runtime | About 69x faster, about 96% less memory, and database connections held 84x shorter |
| Moved exports into an in-process background worker | It still shares CPU and memory with the web app, and job state is lost on restart | Exports stopped slowing down the web app, with almost no new infrastructure |
| Enforced JV isolation in two layers (API filter and per-query scoping) | Some scoping logic is duplicated | If one layer fails, the other still protects the data |
What we'd tell another team
- Put complexity where volume is lowest. Validate aggressively on writes, and keep high-volume reads boring.
- Use abstractions for the problems they were designed to solve. An ORM isn't bad, and raw SQL isn't automatically better. What matters is whether the abstraction matches the workload.
- Control the failure domain. A reporting or export feature should never be able to take down the web application. Next time a review turns into ORM versus raw SQL, or workflow engine versus tables, ask this first:
Where does this rule run, how often, and what happens to everyone else when it fails?
Correctness is necessary. Placement is what decides whether it hurts you.